終値
4,340.70
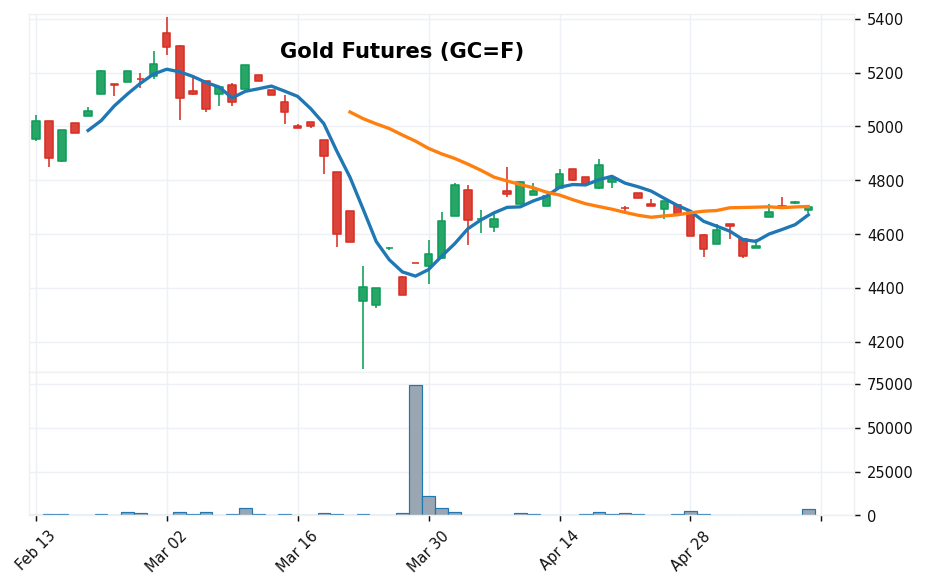
金先物は前日比 +2.33% で上昇しました。比較対象の9市場では、騰落率が高い順に2位です。最も強かったのは銀先物(+3.08%)、最も弱かったのは銅先物(-1.74%)でした。
同じ方向に動いた関連市場は6件、逆方向に動いた市場は1件です。これは各市場の最新2終値から算出した方向の件数であり、相場全体の傾向や値動きの原因を断定するものではありません。
| 関連市場 | 前日比 | 金先物との方向 |
|---|---|---|
| 銀先物 | +3.08% | 同方向 |
| WTI原油先物 | +1.15% | 同方向 |
| ブレント原油先物 | +1.29% | 同方向 |
| 天然ガス先物 | +0.83% | 同方向 |
| 銅先物 | -1.74% | 逆方向 |
| プラチナ先物 | +1.22% | 同方向 |
騰落率は各市場の最新取得日を基準にした機械集計です。休日や時差により比較対象の日付が異なる場合があります。
金先物の前日比は+2.33%です。5営業日前の終値との比較は+7.20%です。20営業日前の終値との比較は+5.76%です。25営業日前の終値との比較は+3.66%です。現在値は直近20営業日の終値レンジの上側(安値を0、高値を100とした位置は100)にあります。機械判定タグは「5日線上・25日線上・30日高値」です。ここでは取得データから確認できる変化だけを記載し、ニュース等の裏付けがない値動きの原因は推測していません。
前日比・期間変化・更新日の算出方法を確認できます。
個別解説の編集確認: 世界の日足 編集部 / 最終更新: 。当日の価格・騰落率・順位は別途自動集計しています。
価格確認用の外部ページ: Yahoo Finance。OHLCの取得経路と算出方法はデータ出典・算出方法に記載しています。当サイトは参照先、取引所、指数提供会社との提携関係にはありません。
Gold Futures rose +2.33% on the latest session and ranks 2 of 9 markets by daily change. The strongest was Silver Futures (+3.08%); the weakest was Copper (-1.74%).
6 related markets moved in the same direction and 1 moved in the opposite direction. Most related markets moved in the same direction.
| Related Market | Daily Change | Direction vs. Gold Futures |
|---|---|---|
| Silver Futures | +3.08% | Same direction |
| WTI Crude Oil | +1.15% | Same direction |
| Brent Crude Oil | +1.29% | Same direction |
| Natural Gas | +0.83% | Same direction |
| Copper | -1.74% | Opposite direction |
| Platinum | +1.22% | Same direction |
Daily changes are calculated mechanically from each market's latest available data. Dates may differ because of holidays and time zones.
The daily change for Gold Futures is +2.33%. Compared with the close 5 trading sessions earlier, the change is +7.20%. Compared with the close 20 trading sessions earlier, the change is +5.76%. Compared with the close 25 trading sessions earlier, the change is +3.66%. The latest close is in the upper part of its 20-session closing range (100 on a scale where the low is 0 and the high is 100). This overview describes only changes visible in the acquired data and does not infer causes without supporting information.
See how daily changes, period changes and update dates are calculated.
Guide reviewed by World Daily Charts Editorial Team; last updated . Current prices, changes and rankings are calculated separately each day.
See Data Sources & Methodology for the OHLC data path and calculation rules. This site is not affiliated with the referenced sources, exchanges or index providers.
It shows daily, weekly and monthly candlesticks so you can compare recent movement with the longer-term market direction.
Compare contracts in the same commodity group, then review stock indices and currencies for broader market context.
Continuous futures series can include contract-roll effects and may not match spot prices. The charts are for market observation and are not investment advice.
金先物は、金利、ドル相場、リスク回避姿勢などの影響を受けやすい商品先物です。このページでは最新更新日 2026/08/07 の日足ローソク足チャートを中心に、週足・月足もあわせて掲載しています。日足では直近の上昇・下落の勢い、ローソク足の並び、移動平均との位置関係を確認し、短期的な市場心理や方向感を把握できます。関連チャートとして 銀先物、WTI原油先物、ブレント原油先物、天然ガス先物、銅先物、プラチナ先物、パラジウム先物、とうもろこし先物 へのリンクも掲載しています。掲載情報は市場観測のための参考情報であり、投資判断を推奨するものではありません。
日足では短期の勢い、週足では数週間単位の方向感、月足では長期の位置を確認できます。複数期間を見比べることで、短期の値動きが大きな流れの中でどこにあるかを整理できます。
本ページの終値、前日比、25営業日前比、順位は、取得済みの日次OHLCデータをもとに機械的に算出しています。ローソク足画像は同じデータから独自生成しており、日足・週足・月足の切り替えで集計期間の違いを確認できます。基礎解説の編集確認日と、日々変わる市場データ日は別に表示しています。
金先物の期近系列を通じて、国際的な金価格の方向を観察するためのチャートです。 日足では直近の変化、週足・月足ではより長い期間の方向を確認します。
銀で貴金属内部、ドル円・ユーロドルで通貨、S&P 500とVIXで株式市場の警戒度を確認します。
連続先物系列には限月交代の影響が含まれることがあり、現物価格や国内小売価格と一致しません。 表示単位については、通常は1トロイオンスあたりの米ドルで表示します。円換算価格はドル円の変動によって異なります。 関連ページでは銀先物、WTI原油先物、ブレント原油先物、天然ガス先物、銅先物、プラチナ先物、パラジウム先物、とうもろこし先物も確認できます。
このページは、金先物の日足ローソク足チャートを確認するための詳細ページです。掲載情報は投資判断を推奨するものではありません。
チャート画像の無断転載、再配布、商用利用はご遠慮ください。各データ提供元・取引所・指数提供会社・Yahoo Finance等とは提携していません。